
Is it me or is it them?
A first check before debugging your own code, for you and your AI assistant.
When an external API starts failing, the first instinct is often to look inward.
Maybe a token expired. Maybe a deployment changed something subtle. Maybe a request that worked yesterday has suddenly stopped being accepted.
But suppose GitHub's API starts returning 5xx errors, or Claude keeps timing out. Before spending time investigating your own code, wouldn't it make sense to check whether the provider is already reporting a problem?
That's what incidents is for.
It's a small terminal tool that checks the status pages of services such as GitHub, npm, Cloudflare, AWS and Claude, and brings their declared incidents together in one place, worst first.
I released it as an open-source npm package on 13 November 2026. It had reached 0.4.0 by the evening, and 0.7.1 four days later.
It was designed for two readers from the beginning: people using a terminal, and scripts that need the same information without an interactive interface. That second use became especially interesting when I connected it to Claude Code.
Unknown is not green
The most important rule in incidents has little to do with its interface.
It doesn't check whether a service actually works for you. It reads what the vendor has declared on its own status page.
Those are different things.
A green status means the vendor isn't reporting a problem. It doesn't prove your calls work. An outage might affect a particular region or component, or simply not have appeared on the status page yet.
The application makes that limitation explicit:
Declared status only: green is not proof your calls work.
The reverse matters too.
If incidents can't read a vendor's status page, it displays ? unreadable. That service is sorted above healthy ones, and the command returns a non-zero exit code.
An unavailable status page is missing information, not evidence that everything is fine.
I'd rather see an honest question mark than a reassuring green dot that doesn't mean anything.
One check, two readers
Running incidents opens an interactive terminal interface. Services appear as their status pages respond, with trouble brought to the top. While pages are still answering, the cards stay where they are; once the last one is in, the healthy services settle into a line each, once, rather than the screen reshuffling under your cursor.
Statuses appear as small pills with the word inside, such as major, minor, unreadable or ok. The colour helps, but the word is what carries the meaning.
There are two views. The board opens by default, with a filter column down the left that doubles as the tally: each status, its count and a small bar. The arrow keys move across the cards in both directions. Press v for the list instead, every service worst first with a preview of the one you're on.
incidents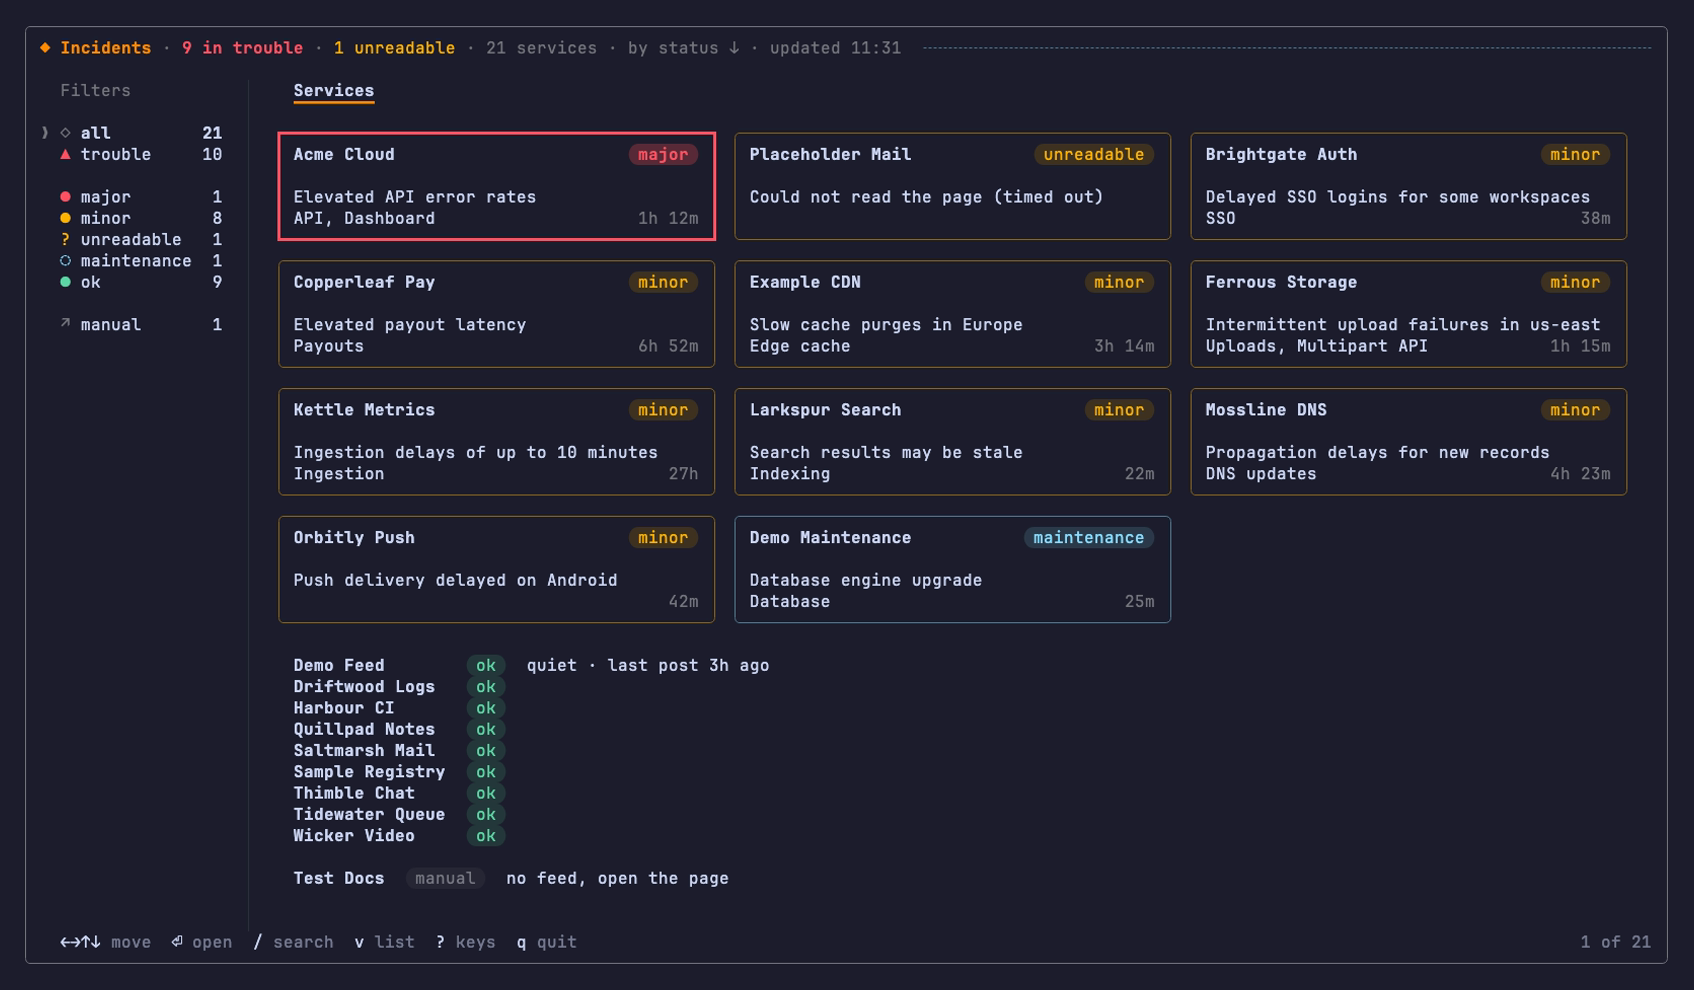
incidents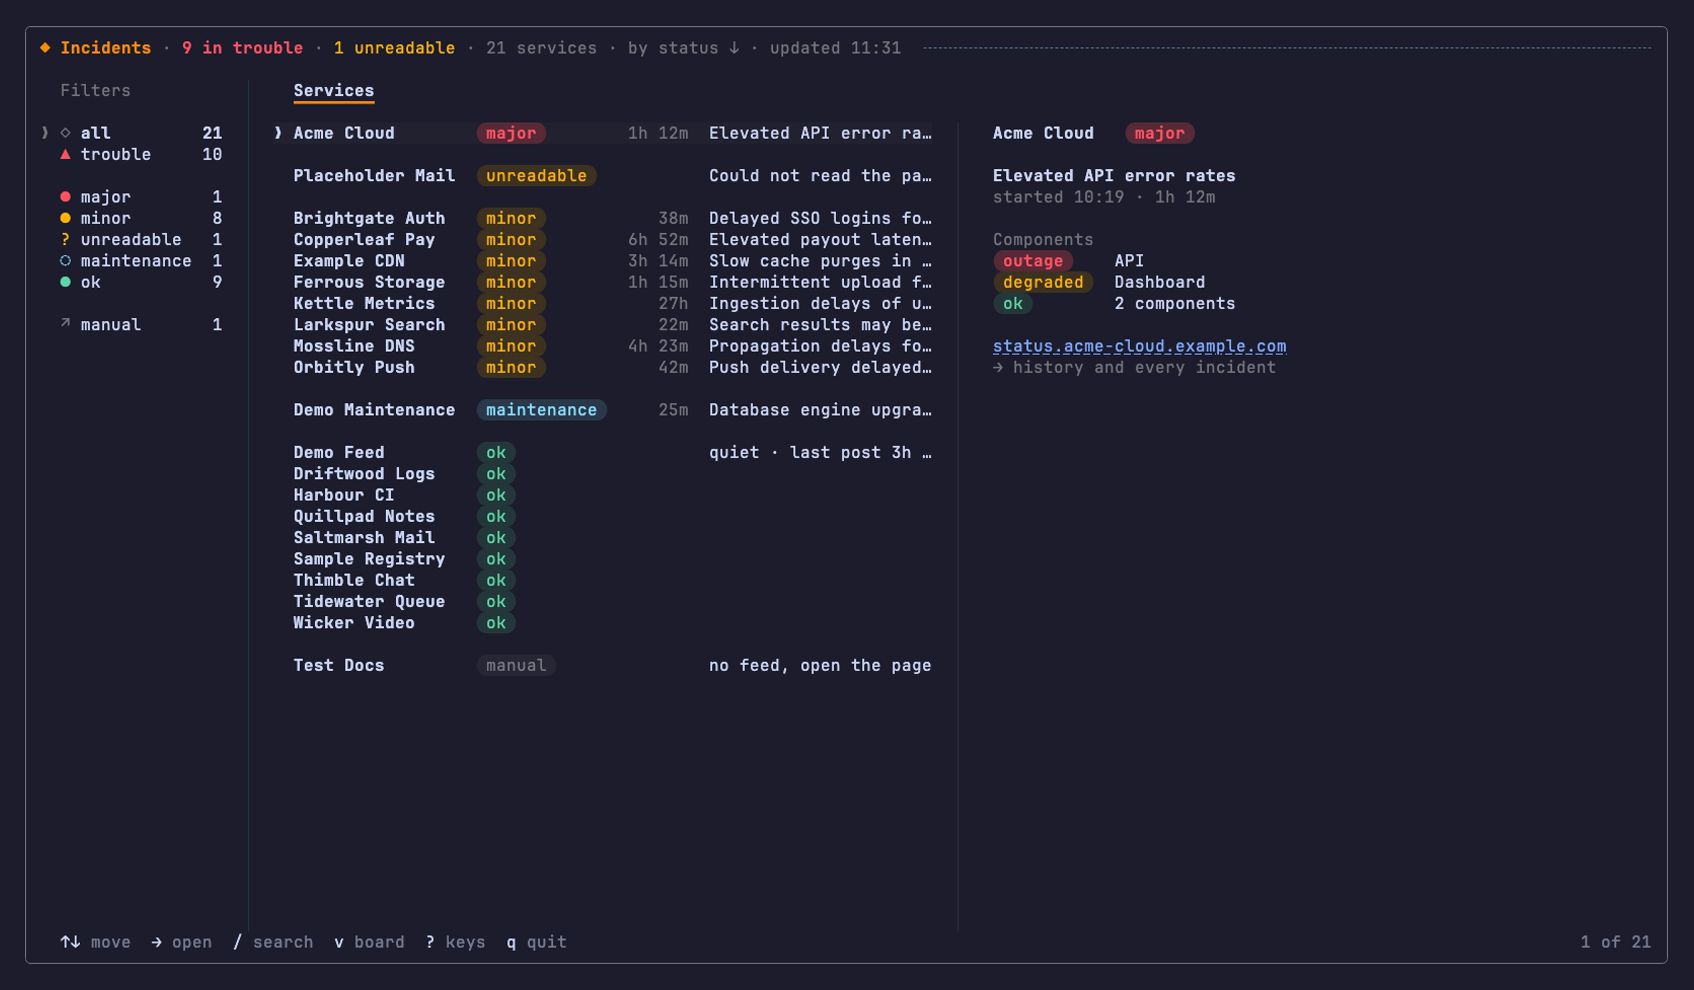
You can sort by severity or name, tab into the filter column to narrow the view, search, or fold the healthy services out of the way.
Some services matter more than others. Press p on one and it's pinned: it moves to a Pinned group at the top of the board and stays a card even when it's healthy, so the two or three you actually depend on, say GitHub and Claude, are never folded away. Pins are remembered between runs, or you can set pinned: true in the config.
incidents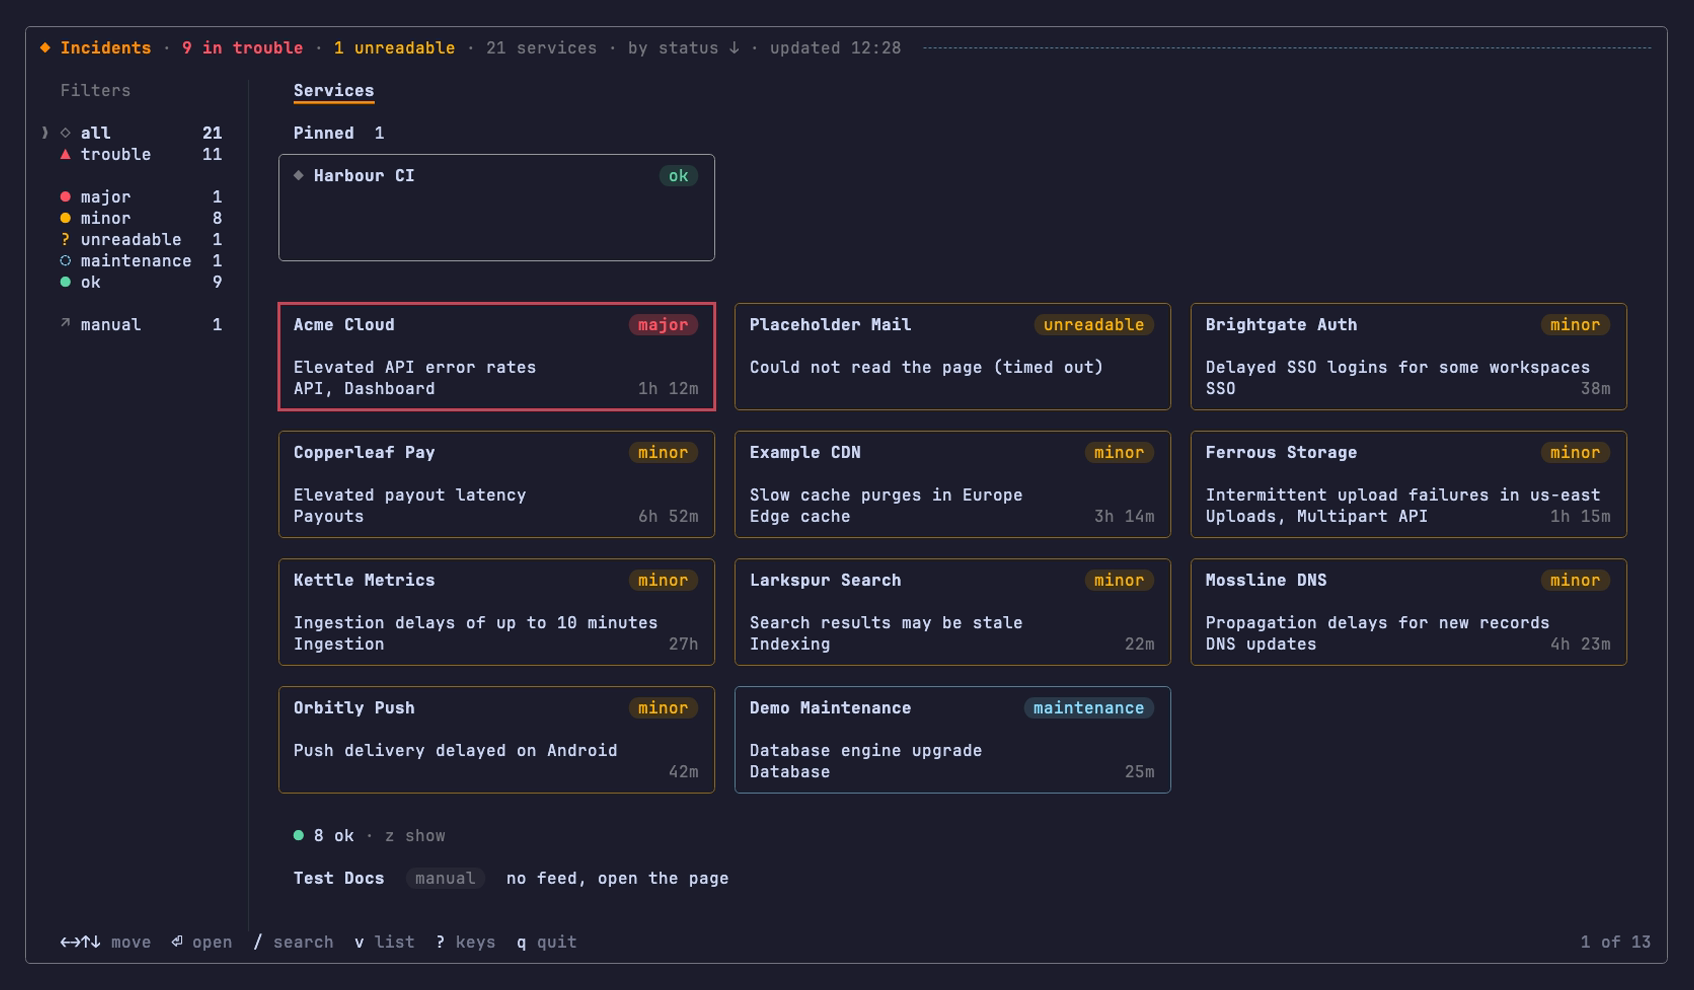
Open a service and its page splits into what's happening now and what happened before.
incidents harbour-ci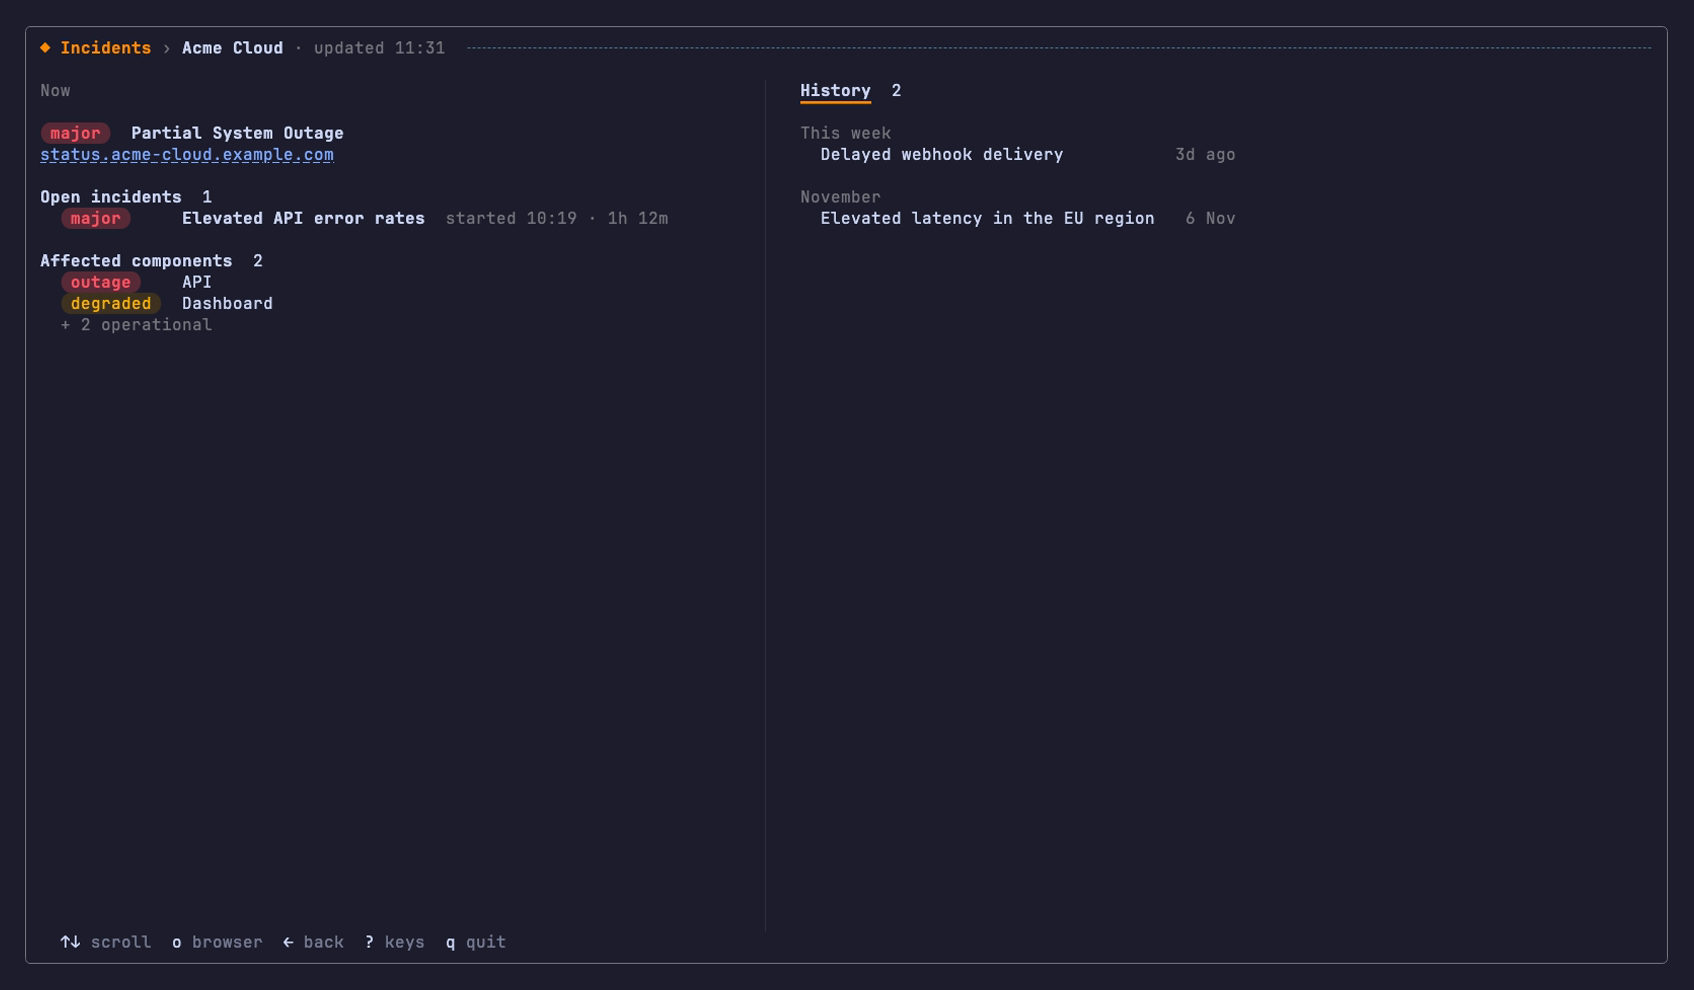
Some status pages list dozens of components. Rather than a wall of them, incidents groups the affected ones by status, worst first, and says how many more there are. History comes from the vendor's incidents API rather than its RSS feed, which on a page that schedules a lot of maintenance fills up with future windows and pushes real incidents out. Upcoming maintenance is counted on its own, and if that count can't be read, it's left unknown rather than shown as zero.
incidents example-cdn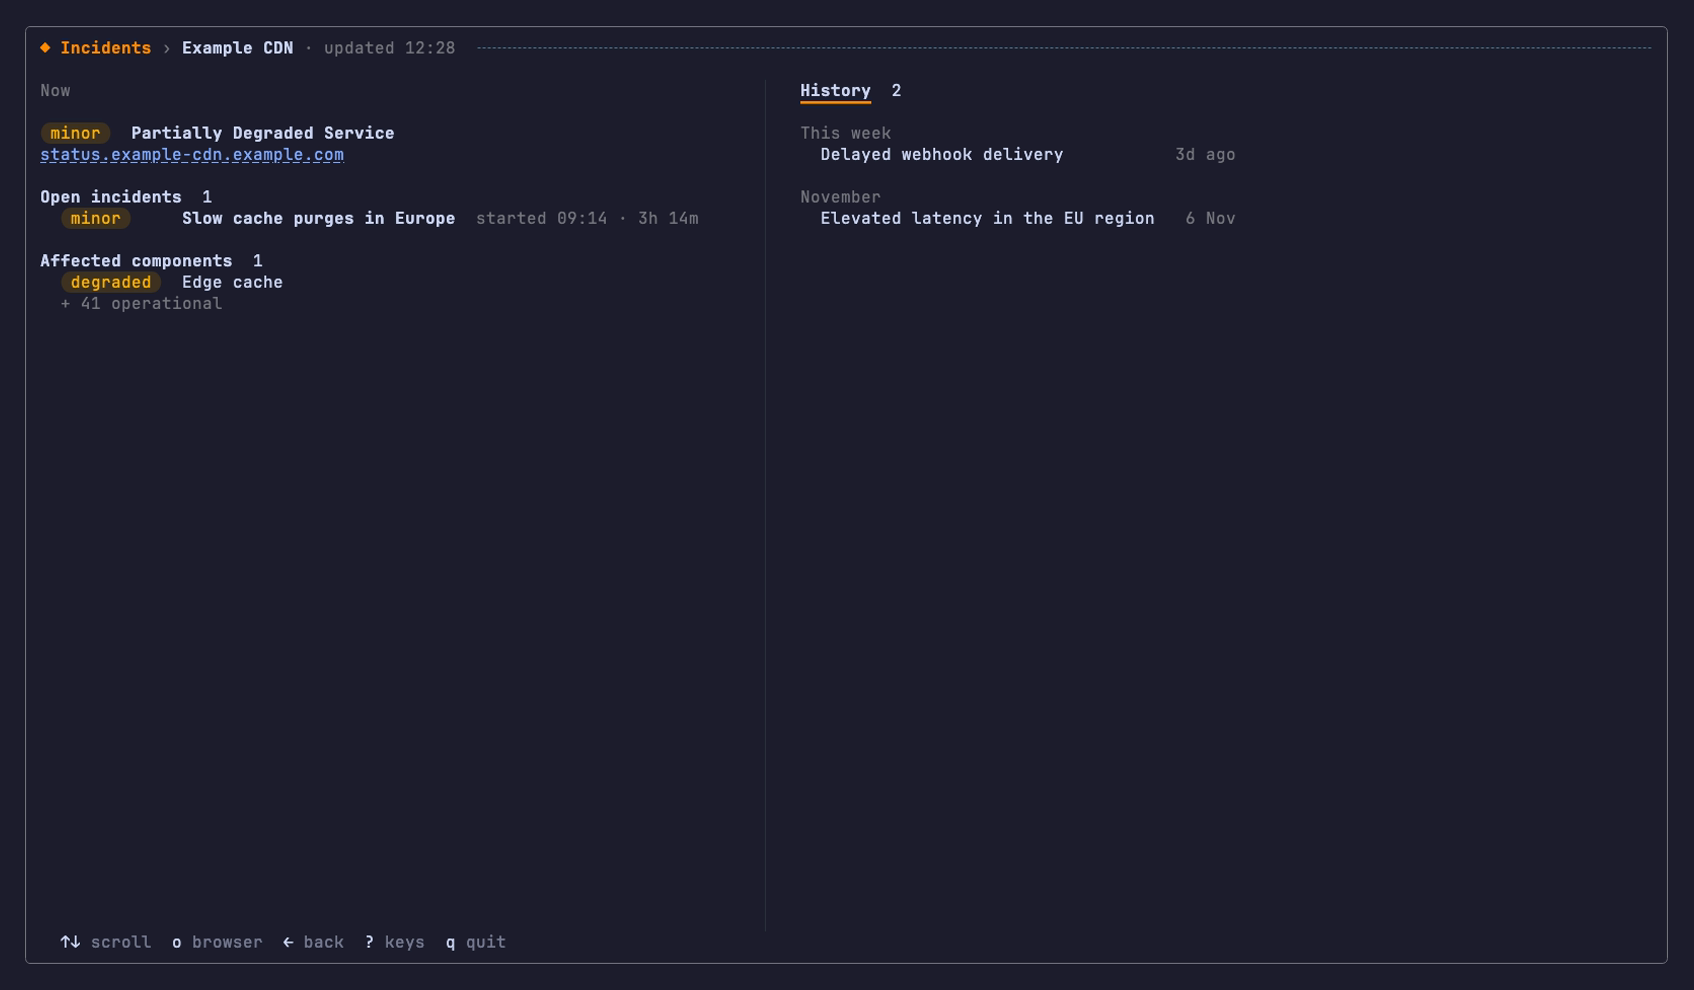
For scripts, there's a simpler interface:
incidents list --jsonIt returns a JSON array with one record per service, ordered worst first, and exits with a meaningful code:
-
0means all clear. -
1means something is degraded or a status page couldn't be read. -
2means a usage or configuration error.
Without an interactive terminal, incidents automatically falls back to static or JSON output. A script never ends up waiting for someone to navigate a fullscreen interface.
The same rules apply whether a person or a program is reading the result.
There's also incidents watch, for when you'd rather not look at all. It says where everything stands when it starts, then checks every few minutes and prints a line only when something changes, and with --exec it runs a command of your choice on each change: a desktop notification, a sound, or a voice telling you GitHub is down again.
incidents watch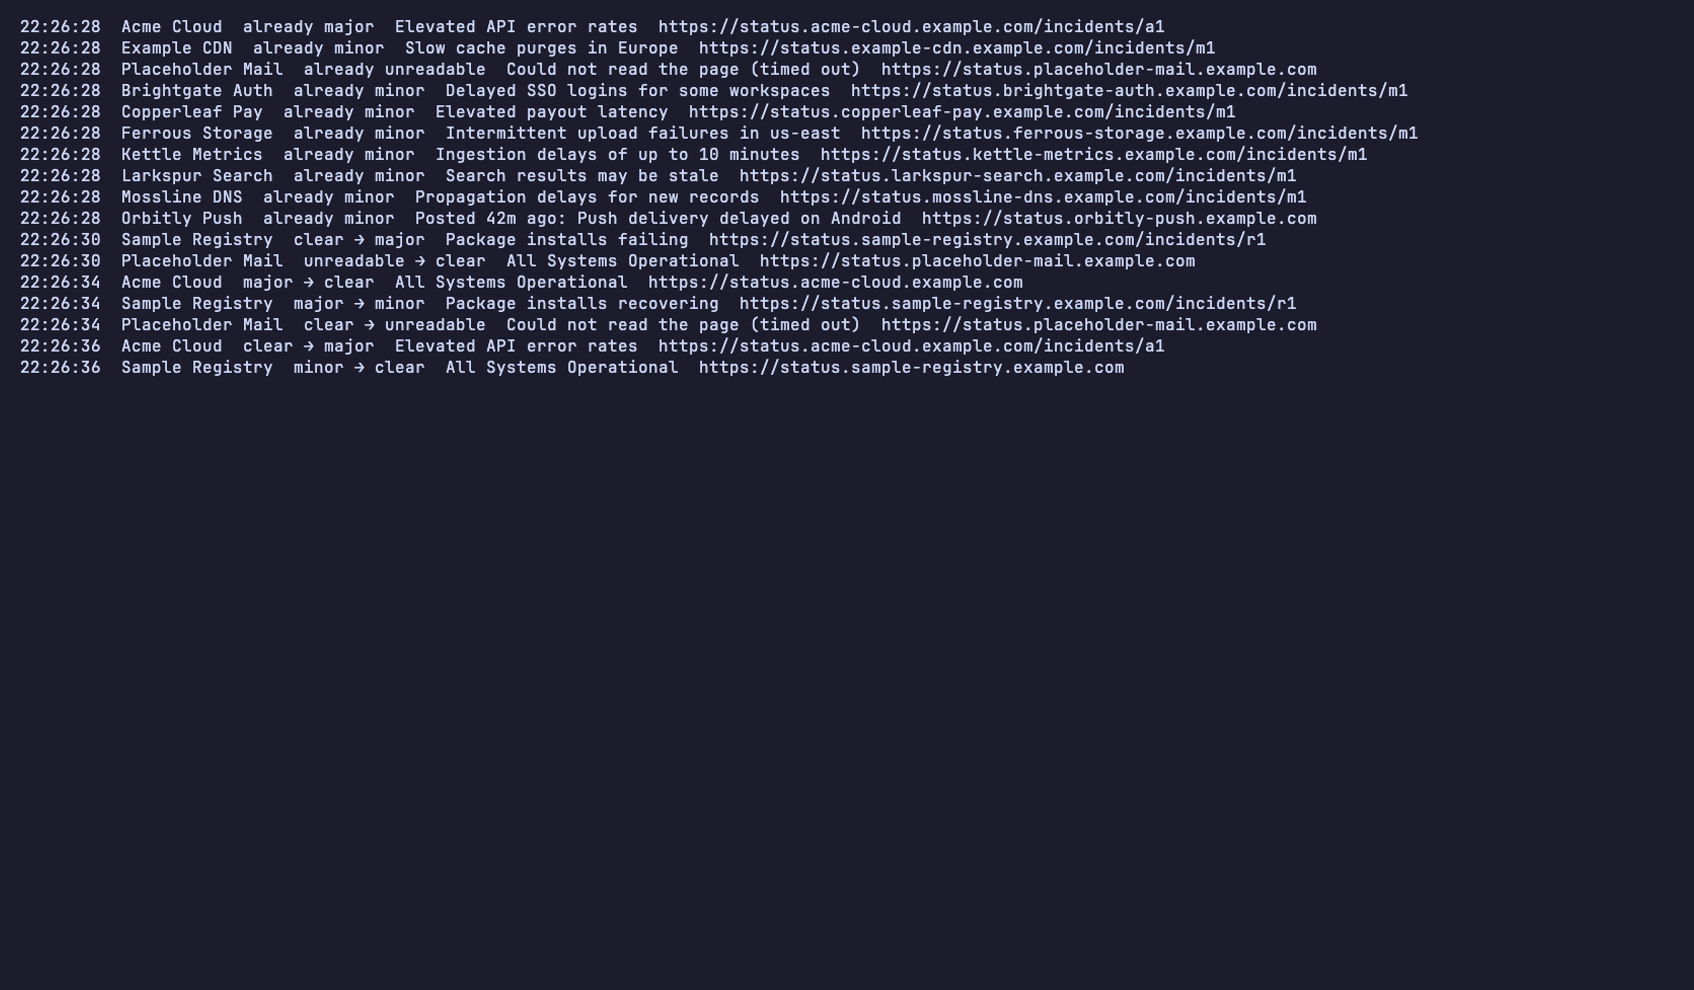
And since Claude Code can run terminal commands while investigating software problems, I thought it should be able to ask that first question too.
Teaching Claude to check first
I published an incidents plugin for Claude Code.
There's no MCP server, separate API or background service. The plugin is a single skill: a Markdown file containing instructions that teach Claude when to check vendor status and how to interpret the result.
The interesting part is when the skill applies.
It describes symptoms rather than waiting for someone to mention incidents by name. A third-party API returning 5xx errors, requests timing out, or a question like "Is GitHub down?" can prompt Claude to check the vendor's status before investigating the application's code.
It runs:
incidents list --jsonIf incidents is installed globally, the plugin uses that copy. Otherwise, a small bundled script runs the npm package through npx.
But running the command is only half the job. The skill also teaches Claude how to interpret what comes back.
If a status page couldn't be read, Claude must report that uncertainty instead of treating the service as healthy.
If a service has no machine-readable status page, incidents marks it as a manual check. Claude can provide the link rather than claim to know its status.
And if everything is green, Claude can report that the vendors aren't declaring trouble, but it should continue investigating the original error.
That's the useful part of the integration for me. The assistant doesn't need a complicated monitoring system or a new set of rules. It uses the same information and respects the same limitations as the person looking at the terminal.
For Claude Code users, the plugin is available through the marketplace:
/plugin marketplace add kud/claude-plugins
/plugin install incidents@kud --scope user
Nothing disappears silently
The same concern about misleading information influenced the interface.
Filters show their counts. Search and folding help when there are too many services to scan comfortably. But whenever something is hidden, incidents says how many services are out of view and how to bring them back.
During development, the board view had a bug that silently dropped services from its grid.
They weren't reported as healthy, unhealthy or unknown. They were simply absent from the screen.
That was fixed before the 0.2.0 release, along with scrolling and overflow handling for smaller terminals.
It's a fairly ordinary UI bug, except that silently losing information is particularly unfortunate in a tool intended to show you what's going wrong.
The same applies to an AI assistant. If a service isn't configured, it wasn't checked. If the status page couldn't be read, the result is unknown. Neither the interface nor Claude should fill those gaps with green.
The first thirty seconds
Incidents isn't an observability platform or a replacement for debugging.
It can't tell you whether a particular outage affects your account, whether a provider has acknowledged every failure, or exactly what's broken in your application.
It answers a smaller question:
Are the services I depend on declaring trouble right now?
Sometimes that gives you an immediate lead. Sometimes the answer is inconclusive, and you carry on investigating.
The point is to make that first check quick enough to become a habit, whether you're debugging yourself or working with Claude Code.
Before investigating your own code, see what the other side is reporting.
And if the answer is unknown, leave it unknown.
Install incidents on npm · Documentation · Source code · Claude Code plugin
Projectsincidents-cli →claude-plugins →